
Observability for Workers VPC Services
Each VPC Service now has a Metrics tab so you can monitor connection health and debug failures without leaving the dashboard.
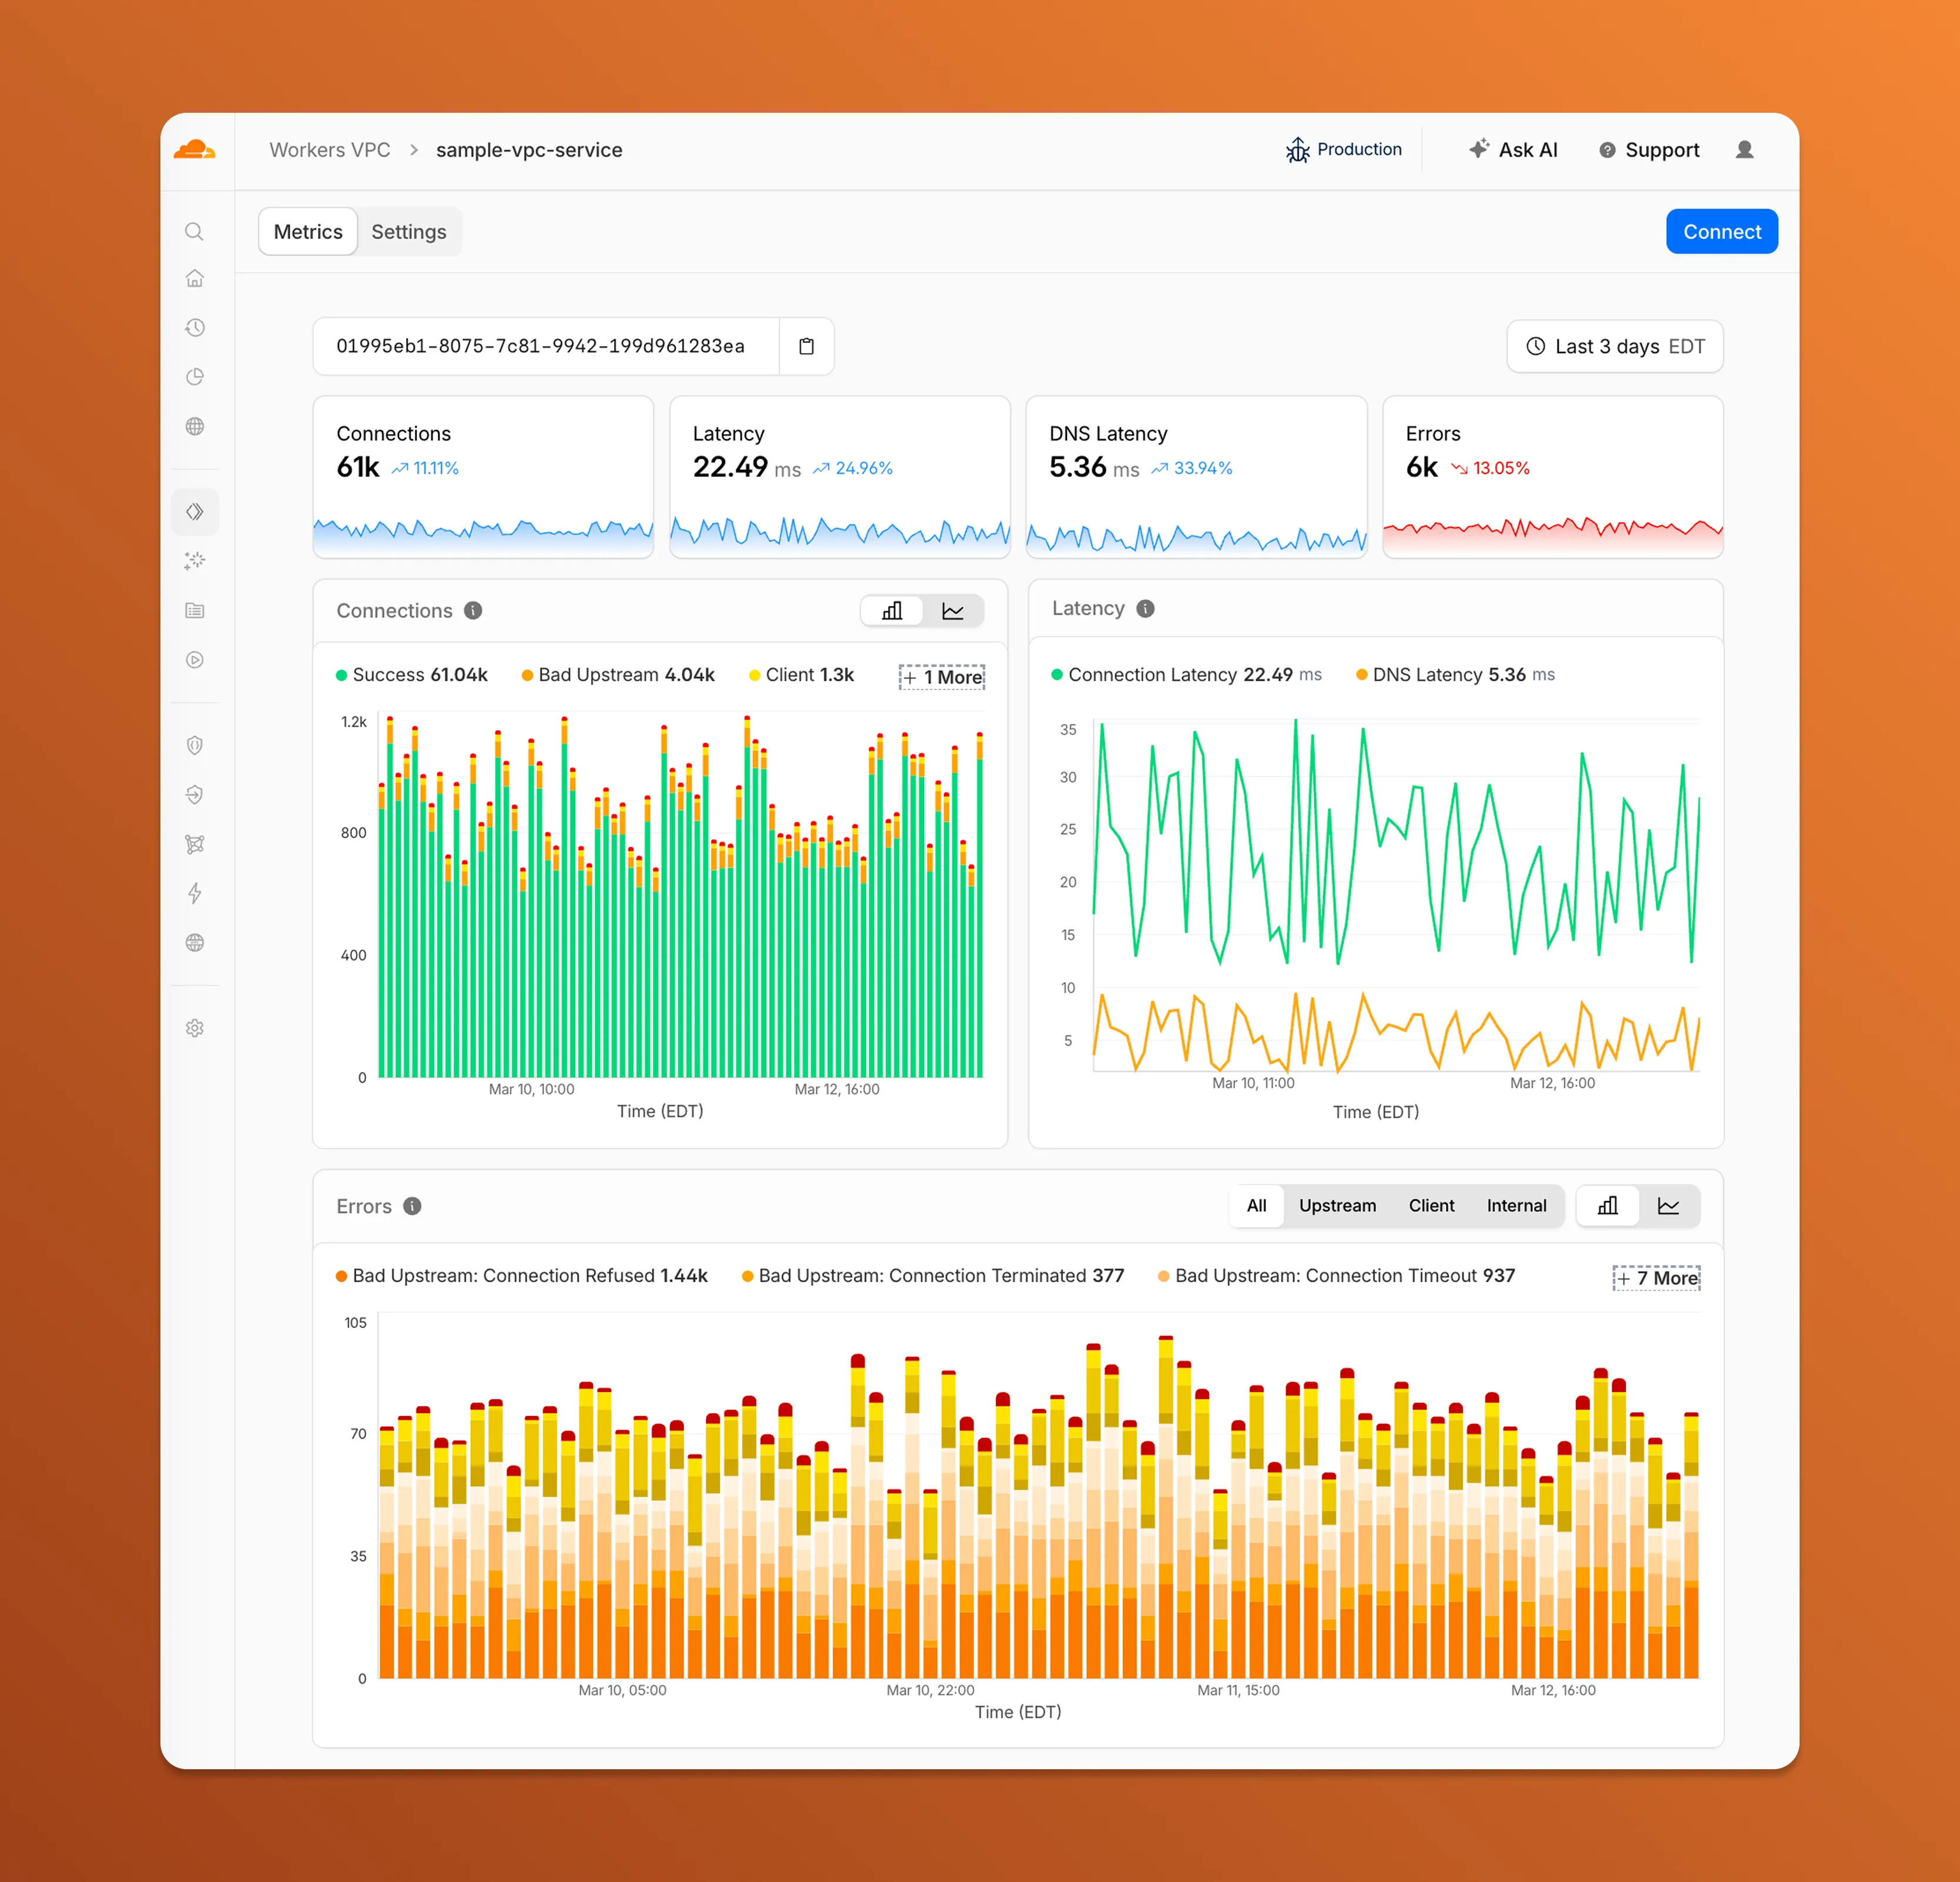
- Connections — See successful and failed connections over time, broken down by what is responsible: your origin (Bad Upstream), your configuration (Client), or Cloudflare (Internal).
- Latency — Track connection and DNS resolution latency trends.
- Errors — Drill into specific error codes grouped by category, with filters to isolate upstream, client, or internal failures.
You can also view and edit your VPC Service configuration, host details, and port assignments from the Settings tab.
For a full list of error codes and what they mean, refer to Troubleshooting.