
Cloudflare Access now supports IdP federation, which allows organizations to share a single identity provider across multiple Cloudflare accounts.
Instead of configuring the same IdP (for example, Okta or Entra ID) separately in every account, you configure it once in a source account and share it with the other accounts in your organization. Each recipient account gets a read-only IdP connection that routes authentication back to the source account through a bridge — a hidden application in the source account that brokers the cross-account login. End users sign in with their existing IdP credentials, and each account's Access policies evaluate the resulting identity just like any other IdP login.
Key capabilities:
- One IdP, many accounts — Configure your IdP once and share it with all accounts in your organization.
- Lifecycle management — As accounts join or leave your Cloudflare organization, their IdP connections are provisioned and removed automatically — no manual cleanup required.
- Immutable recipient connections — IdP connections in recipient accounts cannot be accidentally modified or deleted.
To get started, refer to IdP federation.
Pay-as-you-go customers can now view billable usage and create budget alerts directly from the product overview pages for Workers & Pages, D1, R2, Workers KV, Queues, Vectorize, Durable Objects, and Containers. A new sidebar widget shows current-period spend and the billing cycle date range, alongside a button to create a budget alert.
The widget pulls from the same data as the Billable Usage dashboard and aligns to your billing cycle (or the current day on Free plans), so the numbers match your invoice. Enterprise contract accounts are not yet supported.
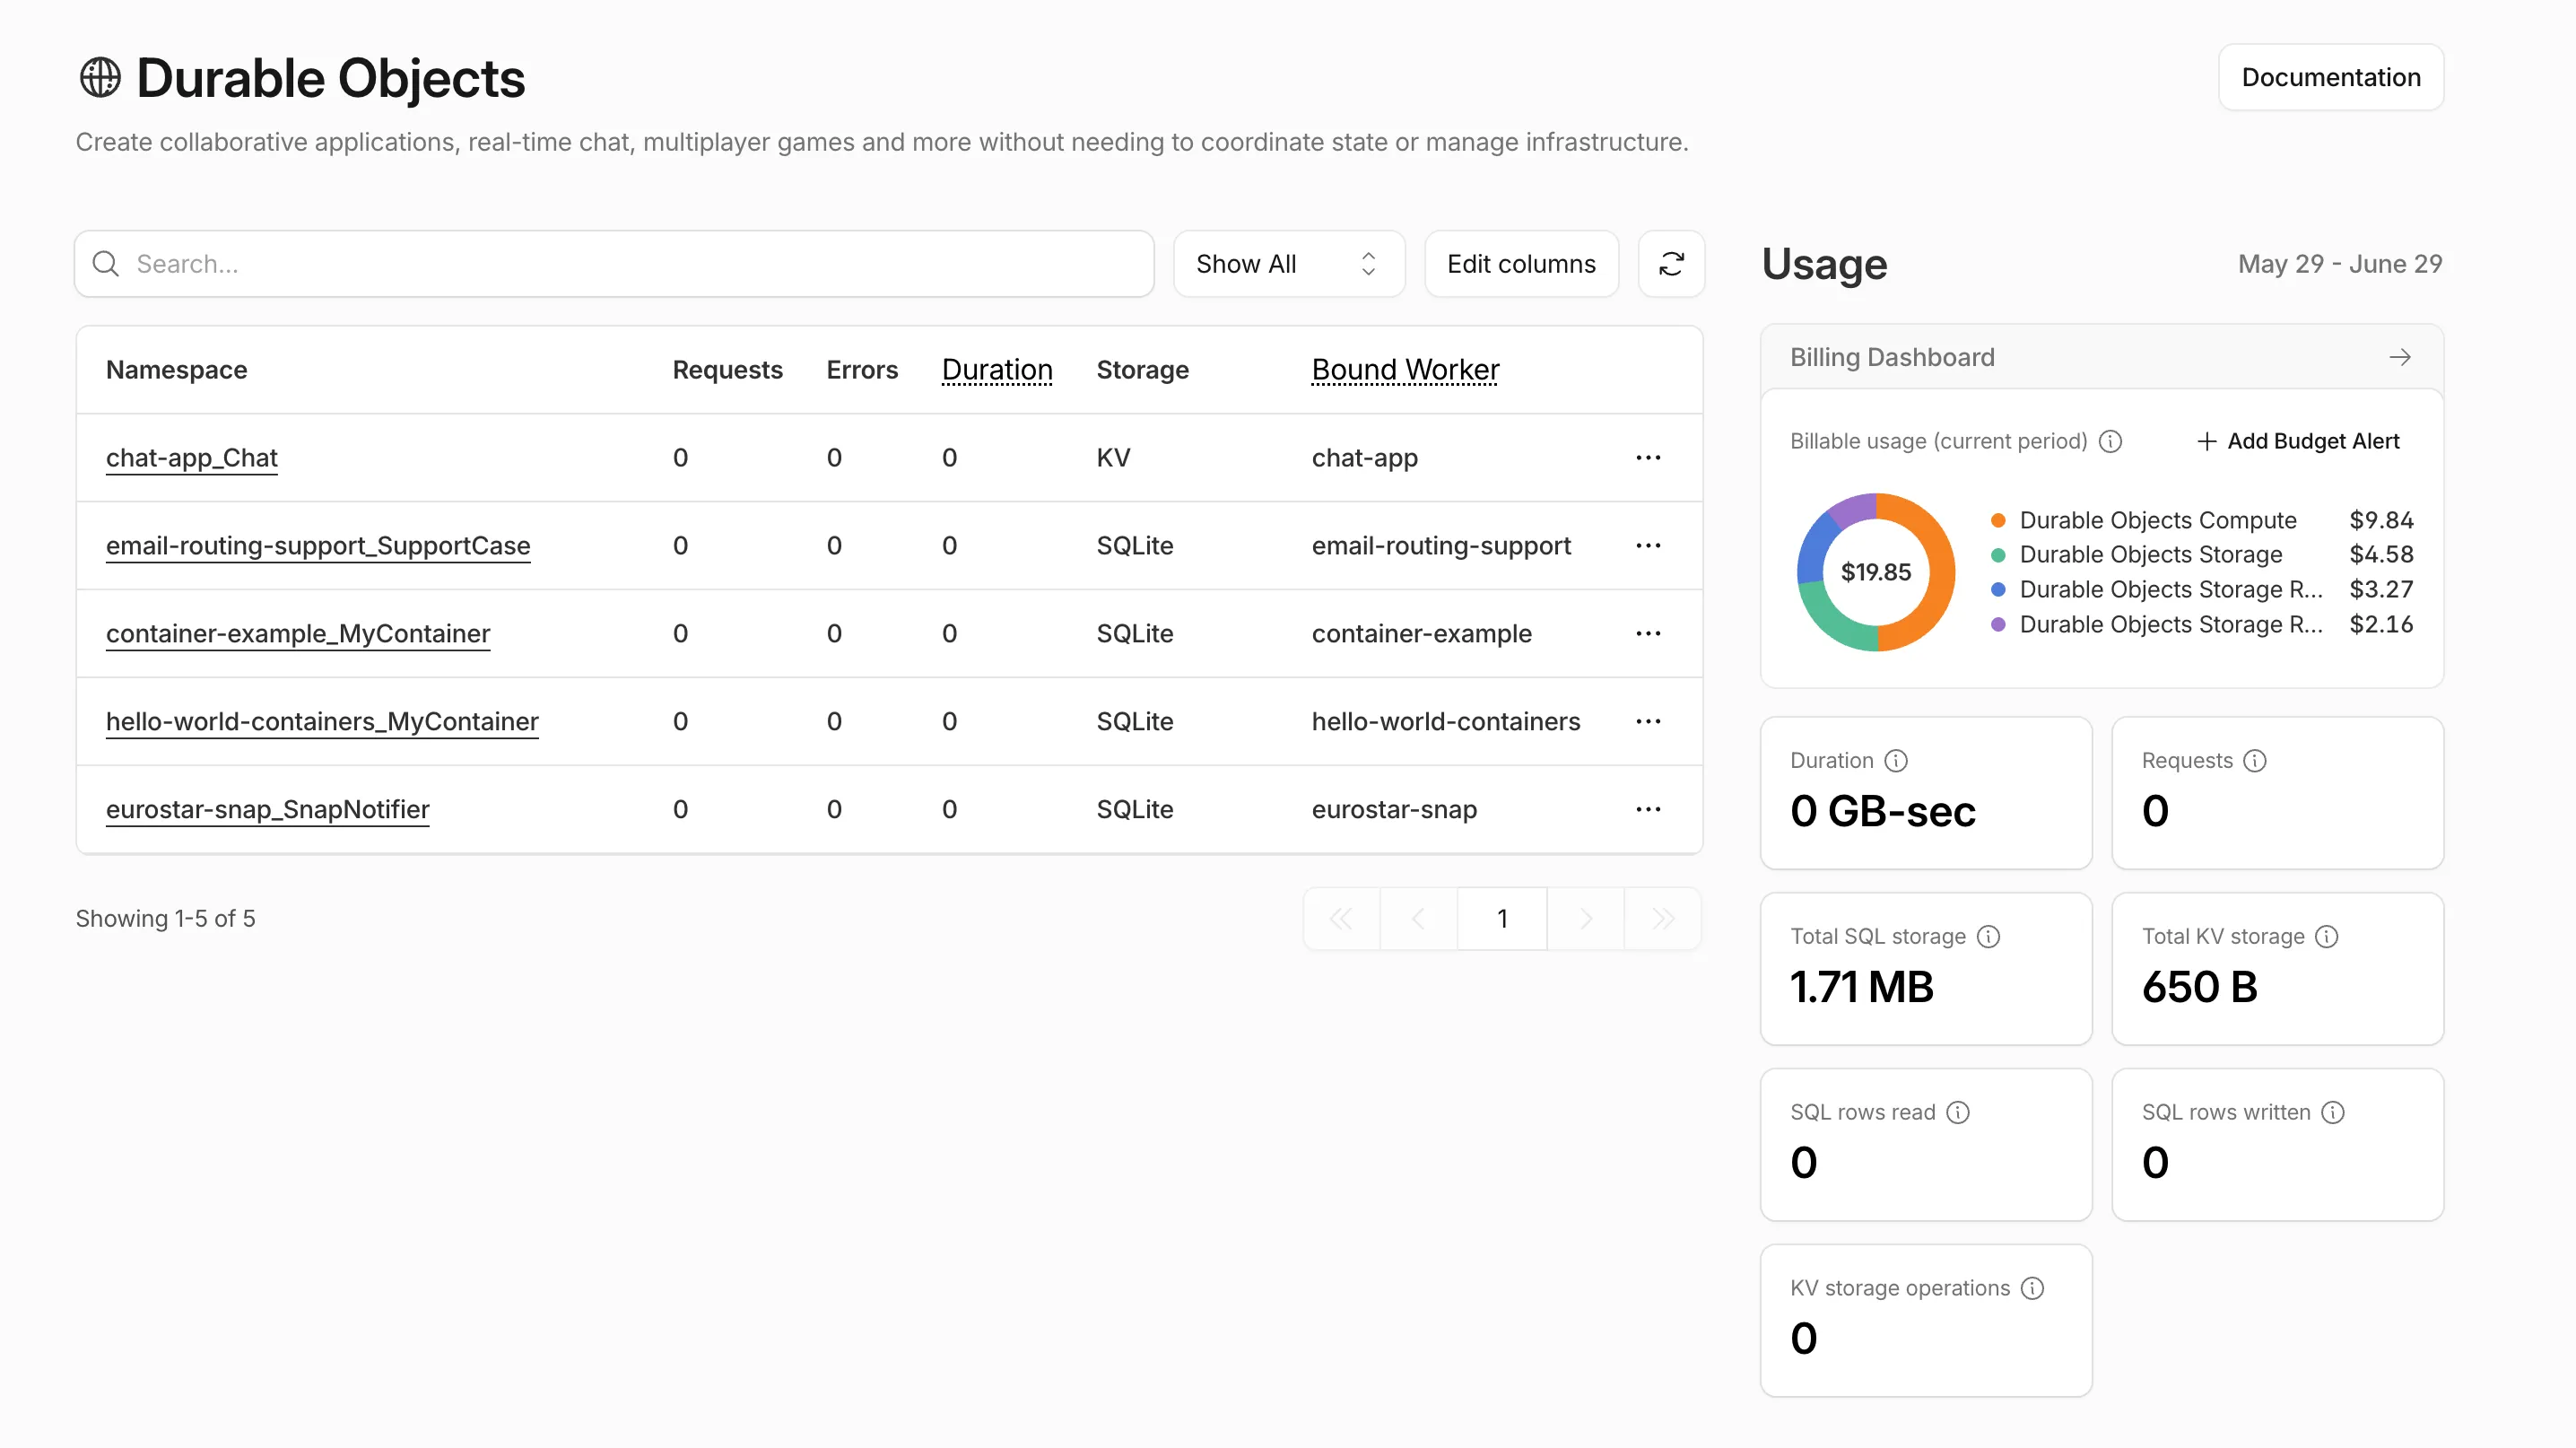
Selecting Create budget alert opens the budget alert flow inline so you can set a dollar threshold in the same place you are reviewing usage. Budget alerts apply to your total account-level spend across all products, not just the product page you create them from.
For more information, refer to the Usage-based billing documentation.
The
pipelinefield inside thepipelinesbinding configuration in your Wrangler configuration file has been renamed tostream. The old field is deprecated but still accepted.Update your configuration to use
streamto avoid the deprecation warning.Before (deprecated):
JSONC {"$schema": "./node_modules/wrangler/config-schema.json","pipelines": [{"binding": "MY_PIPELINE","pipeline": "<STREAM_ID>"}]}TOML [[pipelines]]binding = "MY_PIPELINE"pipeline = "<STREAM_ID>"After:
JSONC {"$schema": "./node_modules/wrangler/config-schema.json","pipelines": [{"binding": "MY_PIPELINE","stream": "<STREAM_ID>"}]}TOML [[pipelines]]binding = "MY_PIPELINE"stream = "<STREAM_ID>"No other changes are required. The binding name, TypeScript types, and runtime API (
env.MY_PIPELINE.send(...)) remain the same.For more information on configuring pipeline bindings, refer to Writing to streams.
Cloudflare Access now supports SAML assertion encryption for identity provider integrations. When turned on, your identity provider encrypts SAML assertions using a Cloudflare-managed certificate before sending them through the user's browser. Only Access can decrypt these assertions, protecting sensitive identity data even after TLS termination.
Without encryption, SAML assertions are transmitted in plaintext and could be visible to browser extensions or client-side malware.
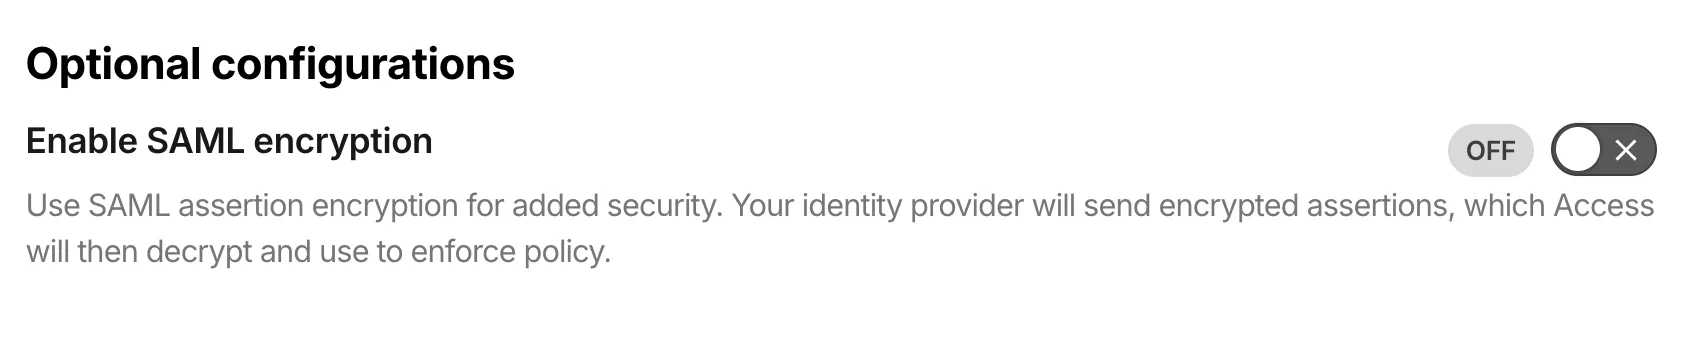
SAML encryption includes built-in certificate lifecycle management:
- Automatic certificate generation: Access generates an encryption certificate when you turn on SAML encryption for an identity provider.
- Certificate rotation: Rotate certificates without downtime. The previous certificate remains valid until expiration, giving you time to update your IdP.
- PEM export: Copy the certificate in PEM format for manual upload to your IdP, or point your IdP to the SAML metadata endpoint for automatic retrieval.
To get started, refer to Encrypt SAML assertions.
Today we are launching self-managed OAuth, enabling developers to build third-party applications that integrate with Cloudflare via OAuth. This provides a more secure, user-friendly, and manageable alternative to API tokens.
OAuth lets third-party applications act on behalf of a user to access their Cloudflare account. For example, after a user grants consent, Wrangler can deploy Workers into that account.
Cloudflare Developers can now create and manage their own OAuth applications to integrate with Cloudflare.
To create an application, go to Manage account > OAuth clients in your account on the Cloudflare dashboard.
Go to OAuth clientsIf you have used an API token to call Cloudflare APIs, OAuth client scopes will look familiar. Select only the scopes your application needs during application creation, and include that scope list when sending users to Cloudflare for consent.
Users can review the requested scopes before they consent.
Applications start with
privatevisibility. Private applications can only be used by members of the account where the application was created.To make an application available to any Cloudflare user, complete the prerequisites for
publicvisibility.For more information, refer to client visibility.
Before an application can be made public, you must verify the client domain. Domain verification helps users confirm that the application owner controls the domain shown on the consent page.
After verification, users see a verified badge on the consent page.
For more information, refer to domain verification.
For more information, refer to OAuth clients.
You can now create, update, or delete multiple secrets for your Worker in a single request using the bulk secrets endpoint.
- Include a secret with a value to create or update.
- Set a secret to
nullto delete. - Secrets not included in the request are left unchanged.
The following example creates
API_KEY, updates the already existingDB_PASSWORD, and deletesOLD_SECRET:{"secrets": {"API_KEY": { "type": "secret_text", "name": "API_KEY", "text": "my-api-key" },"DB_PASSWORD": { "type": "secret_text", "name": "DB_PASSWORD", "text": "my-db-password" },"OLD_SECRET": null}}You can do the same from the command line using
wrangler secret bulk:Terminal window npx wrangler secret bulk < secrets.jsonTo delete a key, set its value to
nullin the JSON file. Deletion is not supported with.envfiles.Each request supports up to 100 total operations (creates, updates, and deletes combined).
You can now attach cron schedules directly to a Workflow binding in
wrangler.jsonc. Each scheduled run creates a new Workflow instance automatically, so you do not need to define a separate Worker with ascheduledhandler just to trigger your Workflow on an interval.For example, you can configure hourly, every-15-minute, or weekday schedules on the same Workflow:
JSONC {"workflows": [{"name": "my-scheduled-workflow","binding": "MY_WORKFLOW","class_name": "MyScheduledWorkflow","schedules": ["0 * * * *", "*/15 * * * *", "0 9 * * MON-FRI"]}]}This makes it easier to build recurring jobs such as database backups, invoice generation, report aggregation, and cleanup tasks without wiring up a separate Cron Trigger entrypoint.
For more information, refer to Trigger Workflows.
Agents SDK v0.14.0: Agent Skills, messengers, scheduled tasks, Workflows, and hardened chat recovery
The latest release of the Agents SDK ↗ adds four new ways to build with
@cloudflare/think: on-demand Agent Skills, chat messengers (starting with Telegram), declarative scheduled tasks, and durable reasoning steps inside Workflows. This release also significantly hardens durable chat recovery, so turns reliably ride through deploys, evictions, and stalled model streams in production.Give an agent a catalog of on-demand instructions, resources, and scripts. A skill source adds a catalog to the system prompt, and the model activates a skill only when a task matches — so a large library of capabilities does not bloat every prompt.
JavaScript import { Think, skills } from "@cloudflare/think";import bundledSkills from "agents:skills";export class SkillsAgent extends Think {getSkills() {return [bundledSkills,skills.r2(this.env.SKILLS_BUCKET, { prefix: "skills/" }),];}}TypeScript import { Think, skills } from "@cloudflare/think";import bundledSkills from "agents:skills";export class SkillsAgent extends Think<Env> {getSkills() {return [bundledSkills,skills.r2(this.env.SKILLS_BUCKET, { prefix: "skills/" }),];}}The
agents:skillsimport bundles a local./skillsdirectory through the Agents Vite plugin (one directory per skill, each with aSKILL.md). Skills can also load from R2 or a manifest. When skills are available, Think exposesactivate_skill,read_skill_resource, and an optionalrun_skill_scripttool. Skill loading is resilient: a duplicate or failing source is skipped with a warning instead of breaking the agent.Agent Skills are experimental, and script execution in particular is early. The API may change in a future release. We would love your feedback — tell us what you are building and what is missing in the Agents repository ↗.
Connect a Think agent directly to a chat platform. Think owns the webhook route, conversation routing, durable reply fiber, and streamed delivery back to the provider. Telegram ships as the first provider.
JavaScript import { Think } from "@cloudflare/think";import {defineMessengers,ThinkMessengerStateAgent,} from "@cloudflare/think/messengers";import telegramMessenger from "@cloudflare/think/messengers/telegram";export { ThinkMessengerStateAgent };export class SupportAgent extends Think {getMessengers() {return defineMessengers({telegram: telegramMessenger({token: this.env.TELEGRAM_BOT_TOKEN,userName: "support_bot",secretToken: this.env.TELEGRAM_WEBHOOK_SECRET_TOKEN,}),});}}TypeScript import { Think } from "@cloudflare/think";import {defineMessengers,ThinkMessengerStateAgent,} from "@cloudflare/think/messengers";import telegramMessenger from "@cloudflare/think/messengers/telegram";export { ThinkMessengerStateAgent };export class SupportAgent extends Think<Env> {getMessengers() {return defineMessengers({telegram: telegramMessenger({token: this.env.TELEGRAM_BOT_TOKEN,userName: "support_bot",secretToken: this.env.TELEGRAM_WEBHOOK_SECRET_TOKEN,}),});}}Each Chat SDK thread maps to its own Think sub-agent by default, so group chats and direct messages do not share memory. Multiple bots, custom conversation routing, and custom providers are all supported.
Declare recurring, timezone-aware prompts and handlers with a typed domain-specific language (DSL). Think reconciles the declarations on startup and re-arms the next occurrence after each run, backed by durable idempotent submissions.
JavaScript import { Think, defineScheduledTasks } from "@cloudflare/think";export class DigestAgent extends Think {getScheduledTasks() {return defineScheduledTasks({weeklyCommitReport: {schedule: "every week on monday at 09:00",prompt:"Compile my GitHub commits for the last week and summarize them.",},workout: {schedule: "every day at 08:00 in Europe/London",prompt: "Start my workout.",},});}}TypeScript import { Think, defineScheduledTasks } from "@cloudflare/think";export class DigestAgent extends Think<Env> {getScheduledTasks() {return defineScheduledTasks({weeklyCommitReport: {schedule: "every week on monday at 09:00",prompt:"Compile my GitHub commits for the last week and summarize them.",},workout: {schedule: "every day at 08:00 in Europe/London",prompt: "Start my workout.",},});}}Run a model-driven reasoning step inside a Cloudflare Workflow with
ThinkWorkflowandstep.prompt(), with durable typed structured output, long waits, and approval gates.JavaScript import { z } from "zod";import { ThinkWorkflow } from "@cloudflare/think/workflows";const draftSchema = z.object({title: z.string(),summary: z.string(),labels: z.array(z.string()),});export class TriageWorkflow extends ThinkWorkflow {async run(event, step) {const draft = await step.prompt("triage-issue", {prompt: `Triage issue #${event.payload.issueNumber}`,output: draftSchema,timeout: "3 days",});await step.do("apply-labels", async () => {await this.agent.applyLabels(draft.labels);});}}TypeScript import { z } from "zod";import { ThinkWorkflow } from "@cloudflare/think/workflows";import type { ThinkWorkflowStep } from "@cloudflare/think/workflows";import type { AgentWorkflowEvent } from "agents/workflows";const draftSchema = z.object({title: z.string(),summary: z.string(),labels: z.array(z.string()),});export class TriageWorkflow extends ThinkWorkflow<TriageAgent, Params> {async run(event: AgentWorkflowEvent<Params>, step: ThinkWorkflowStep) {const draft = await step.prompt("triage-issue", {prompt: `Triage issue #${event.payload.issueNumber}`,output: draftSchema,timeout: "3 days",});await step.do("apply-labels", async () => {await this.agent.applyLabels(draft.labels);});}}Durable chat turns have always been designed to survive a mid-turn deploy or Durable Object eviction. This release is a major hardening pass on that machinery for production.
- Better recovery during deploys. Turns now ride through continuous deploys and evictions without losing completed work or re-running tools that already ran.
- A live "recovering…" signal.
useAgentChatexposes a newisRecoveringflag, so a recovering turn shows progress instead of looking frozen. Most UIs renderisStreaming || isRecoveringas "busy". - Stalled streams recover. Set
chatStreamStallTimeoutMsto route a hung provider stream into the same recovery path instead of leaving an infinite spinner. - Sub-agents re-attach. On parent recovery, an in-flight
agentTool()child is re-attached to its result rather than abandoned and re-run, so long-running children no longer lose work under deploys.
- Resumable streams — In-flight tool calls over Server-Sent Events (SSE) survive a dropped connection. Clients reconnect with
Last-Event-IDand replay anything they missed. - Readable server IDs —
addMcpServeraccepts an optionalid, so tools surface as readable keys (for exampletool_github_create_pull_request) instead of opaque connection IDs. - Better handling of concurrent requests — Overlapping JSON-RPC requests are now correctly correlated to their responses across the HTTP and RPC transports.
- Compaction — A
Session'stokenCounternow also drives the compaction boundary decision ("what to compress"), not just the fire/no-fire trigger. @cloudflare/worker-bundler— Adds avirtualModulesoption tocreateWorkerto provide in-memory module source during bundling.- Client-tool continuations — Parallel tool results now coalesce into a single continuation, immediate resume requests attach to the pending continuation, and server-side
needsApprovalcontinuations resume reliably after approval.
To update to the latest version:
npm i agents@latest @cloudflare/think@latest @cloudflare/ai-chat@latestyarn add agents@latest @cloudflare/think@latest @cloudflare/ai-chat@latestpnpm add agents@latest @cloudflare/think@latest @cloudflare/ai-chat@latestbun add agents@latest @cloudflare/think@latest @cloudflare/ai-chat@latestRefer to the Agents API reference and Chat agents documentation for more information.
The Cisco IOS XE third-party integration guide for Cloudflare WAN has been updated to include:
- Post Quantum Cryptography (PQC)
- Policy-Based Routing (PBR)
- IP Service Level Agreement (IP SLA)
This link will take you directly to the updated Cisco IOS XE guide.
Cloudflare has updated Logpush datasets:
- Turnstile Events: A new dataset with fields including
ASN,Action,BrowserMajor,BrowserName,ClientIP,CountryCode,EventType,Hostname,OSMajor,OSName,Sitekey,Timestamp, andUserAgent.
For the complete field definitions for each dataset, refer to Logpush datasets.
- Turnstile Events: A new dataset with fields including
A new Beta release for the macOS Cloudflare One Client is now available on the beta releases downloads page.
This release introduces the new Cloudflare One Client UI for macOS! You can expect a cleaner and more intuitive design as well as easier access to common actions and information. Here are some of the many things we have found our users appreciate:
- Right click context menu to access the most common client actions quickly
- Built-in captive portal login experience
Additional Changes and improvements
- The client now applies DNS search suffixes configured in your device profile / network policy. Administrators can push a list of DNS search domains that the client appends to single-label queries, alongside any system-configured suffixes. See DNS search suffixes for details.
- Administrators can now control which virtual networks (VNETs) are available to which users via WARP device profile settings in the Zero Trust dashboard. Previously, every VNET in the organization was visible to every device; you can now scope the VNET picker per profile so users only see the networks relevant to them. See VNET availability for details.
- Added a local-file signal source for Emergency Disconnect. In addition to the existing HTTPS polling mechanism, administrators can now configure WARP to monitor for a file on disk; the presence of the file triggers an emergency disconnect even if both Cloudflare and your own infrastructure are unreachable. Either signal being asserted triggers disconnect; both must be cleared for normal operation to resume.
- Added new warp-cli debug commands for interactive connection diagnosis. See Extra debug logging for details.
- The local DNS proxy now supports DNSSEC passthrough. DNSSEC-signed responses are forwarded to the application intact (including DO/AD bits and RRSIG records), so applications that validate DNSSEC locally — including resolvers and the dig/drill tooling — work correctly through the client.
- Added a new MDM format for organization-wide settings, including a cleaner way to configure the compliance environment (e.g. FedRAMP). The previous per-configuration approach still works, but the new format is now recommended. See the updated Cloudflare One MDM documentation for details.
- Client Certificate device-posture checks now support template variables (e.g.
${serial_number},${device_uuid}) in the Subject Alternative Name field, matching what the documentation has always claimed. Previously only the Common Name field accepted variables, which broke posture rules that pinned identity to a SAN entry. - Fixed the in-client captive-portal browser rendering a blank "Success" page on some airline Wi-Fi networks (United inflight Wi-Fi was the reported case). The browser now reliably loads the airline's real portal page so users can complete sign-in from inside the client instead of having to open a separate browser.
- Fixed an issue in proxy mode where hostnames containing underscores (e.g. ai_app.com) were rejected, breaking apps that depend on such hostnames (notably ChatGPT sandbox apps). The local proxy now accepts underscore-containing hostnames in CONNECT requests.
Known issues
- Registration may hang at "Checking your organization configuration" due to IPC errors. A system reboot should resolve the error, allowing registration to proceed.
- Split tunnel list configuration is not available in the new UI. Management of split tunnel entries is currently only possible via
warp-cli tunnel ipandwarp-cli tunnel host. UI support will be added in a future release.
A new Beta release for the Windows Cloudflare One Client is now available on the beta releases downloads page.
This release introduces the new Cloudflare One Client UI for Windows! You can expect a cleaner and more intuitive design as well as easier access to common actions and information. Here are some of the many things we have found our users appreciate:
- Right click context menu to access the most common client actions quickly
- Built-in captive portal login experience
Additional Changes and improvements
- The client now applies DNS search suffixes configured in your device profile / network policy. Administrators can push a list of DNS search domains that the client appends to single-label queries, alongside any system-configured suffixes. See DNS search suffixes for details.
- Administrators can now control which virtual networks (VNETs) are available to which users via WARP device profile settings in the Zero Trust dashboard. Previously, every VNET in the organization was visible to every device; you can now scope the VNET picker per profile so users only see the networks relevant to them. See VNET availability for details.
- Added mandatory authentication. When enabled via MDM, the Cloudflare One Client blocks all Internet traffic from the moment the machine boots until the user authenticates, closing the visibility gap on newly deployed devices and during re-authentication. See the announcement blog and documentation for details.
- Added a local-file signal source for Emergency Disconnect. In addition to the existing HTTPS polling mechanism, administrators can now configure WARP to monitor for a file on disk; the presence of the file triggers an emergency disconnect even if both Cloudflare and your own infrastructure are unreachable. Either signal being asserted triggers disconnect; both must be cleared for normal operation to resume.
- Added new warp-cli debug commands for interactive connection diagnosis. See Extra debug logging for details.
- The local DNS proxy now supports DNSSEC passthrough. DNSSEC-signed responses are forwarded to the application intact (including DO/AD bits and RRSIG records), so applications that validate DNSSEC locally — including resolvers and the dig/drill tooling — work correctly through the client.
- Added a new MDM format for organization-wide settings, including a cleaner way to configure the compliance environment (e.g. FedRAMP). The previous per-configuration approach still works, but the new format is now recommended. See the updated Cloudflare One MDM documentation for details.
- Client Certificate device-posture checks now support template variables (e.g.
${serial_number},${device_uuid}) in the Subject Alternative Name field, matching what the documentation has always claimed. Previously only the Common Name field accepted variables, which broke posture rules that pinned identity to a SAN entry. - The UseWebView2 registry value (HKLM\SOFTWARE\Cloudflare\CloudflareWARP\UseWebView2 = y) is once again honored by the new GUI for authentication, so administrators who prefer the embedded WebView2 browser for sign-in can opt back in. This setting was effectively ignored in the previous release; the default browser was always used. This key is now also honored for re-authentications.
- Fixed a crash in the authentication browser when navigating to a site that prompts for browser permissions (microphone, camera, notifications, etc.). The same fix had previously landed for the captive-portal browser; this extends it to the auth browser.
- Fixed an issue in proxy mode where hostnames containing underscores (e.g. ai_app.com) were rejected, breaking apps that depend on such hostnames (notably ChatGPT sandbox apps). The local proxy now accepts underscore-containing hostnames in CONNECT requests.
Known issues
- An error indicating that Microsoft Edge can't read and write to its data directory may be displayed during captive portal login; this error is benign and can be dismissed.
- Registration may hang at "Checking your organization configuration" due to IPC errors. A system reboot should resolve the error, allowing registration to proceed.
- Split tunnel list configuration is not available in the new UI. Management of Split Tunnel entries is currently only possible via
warp-cli tunnel ipandwarp-cli tunnel host. UI support will be added in a future release. - Windows ARM may prompt the user to close running applications while trying to install this version. Simply click “Ok” with the default highlighted option.
- DNS resolution may be broken when the following conditions are all true:
- The client is in Secure Web Gateway without DNS filtering (tunnel-only) mode.
- A custom DNS server address is configured on the primary network adapter.
- The custom DNS server address on the primary network adapter is changed while the client is connected.
To work around this issue, please reconnect the client by selecting "disconnect" and then "connect" in the client user interface.
Sandboxes can expose a service running inside the container on a public preview URL through the
sandbox.tunnelsnamespace. The SDK usescloudflaredinside the sandbox so you can share a running service without configuringexposePort()or a custom domain.By default,
sandbox.tunnels.get(port)creates a quick tunnel ↗ on a zero-config*.trycloudflare.comURL — no Cloudflare account, DNS record, or custom domain required. This is perfect for quick development and for.workers.devdeployments.JavaScript import { getSandbox } from "@cloudflare/sandbox";const sandbox = getSandbox(env.Sandbox, "my-sandbox");await sandbox.startProcess("python -m http.server 8080");const tunnel = await sandbox.tunnels.get(8080);console.log(tunnel.url); // → https://random-words-here.trycloudflare.comTypeScript import { getSandbox } from "@cloudflare/sandbox";const sandbox = getSandbox(env.Sandbox, "my-sandbox");await sandbox.startProcess("python -m http.server 8080");const tunnel = await sandbox.tunnels.get(8080);console.log(tunnel.url); // → https://random-words-here.trycloudflare.comFor more control you can create a named tunnel through
sandbox.tunnels.get(port, { name }). A named tunnel binds a hostname (<name>.<your-zone>) backed by a Cloudflare Tunnel and a CNAME record on your zone resulting in something like https://my-app-preview.example.com ↗.Unlike quick tunnels, which generate a new random URL each time, a named tunnel produces a persistent URL that survives container restarts. This makes named tunnels suitable for production use cases where you want control over the tunnel and it's origin.
JavaScript const tunnel = await sandbox.tunnels.get(8080, { name: "my-app-preview" });console.log(tunnel.url); // → https://my-app-preview.example.comTypeScript const tunnel = await sandbox.tunnels.get(8080, { name: "my-app-preview" });console.log(tunnel.url); // → https://my-app-preview.example.comCalling
sandbox.destroy()tears down the Cloudflare Tunnel and the associated DNS record alongside the container, so you do not leave dangling tunnels or records behind.To update to the latest version:
npm i @cloudflare/sandbox@latestyarn add @cloudflare/sandbox@latestpnpm add @cloudflare/sandbox@latestbun add @cloudflare/sandbox@latestFor full API details, refer to the Sandbox tunnels reference.
Cloudflare has updated Logpush datasets:
- DEX Device State Events (added):
DeviceRegistrationProfileID. - Gateway HTTP (added):
AddedHeaders,DeletedHeaders, andSetHeaders. - HTTP requests (added):
MatchedRules.
For the complete field definitions for each dataset, refer to Logpush datasets.
- DEX Device State Events (added):
The Radar post-quantum TLS support checker ↗ now also reports TLS bugs detected during the handshake test. When a scanned host exhibits compatibility issues, the results include details on the specific bugs detected, along with guidance on how to investigate and remediate each issue. The bugs section only appears for hosts where issues are found.
The following TLS bugs are detected:
- Split ClientHello — The connection fails with a fragmented post-quantum
ClientHellobut succeeds with classical handshakes. Typically caused by middleboxes or firewalls that cannot reassemble split TLS messages. - HRR Failure — The server sends a
HelloRetryRequestbut fails to complete the handshake afterward. - Unknown Keyshare — The server cannot handle unknown key exchange algorithms and fails instead of responding with a
HelloRetryRequestas required by the TLS 1.3 specification.
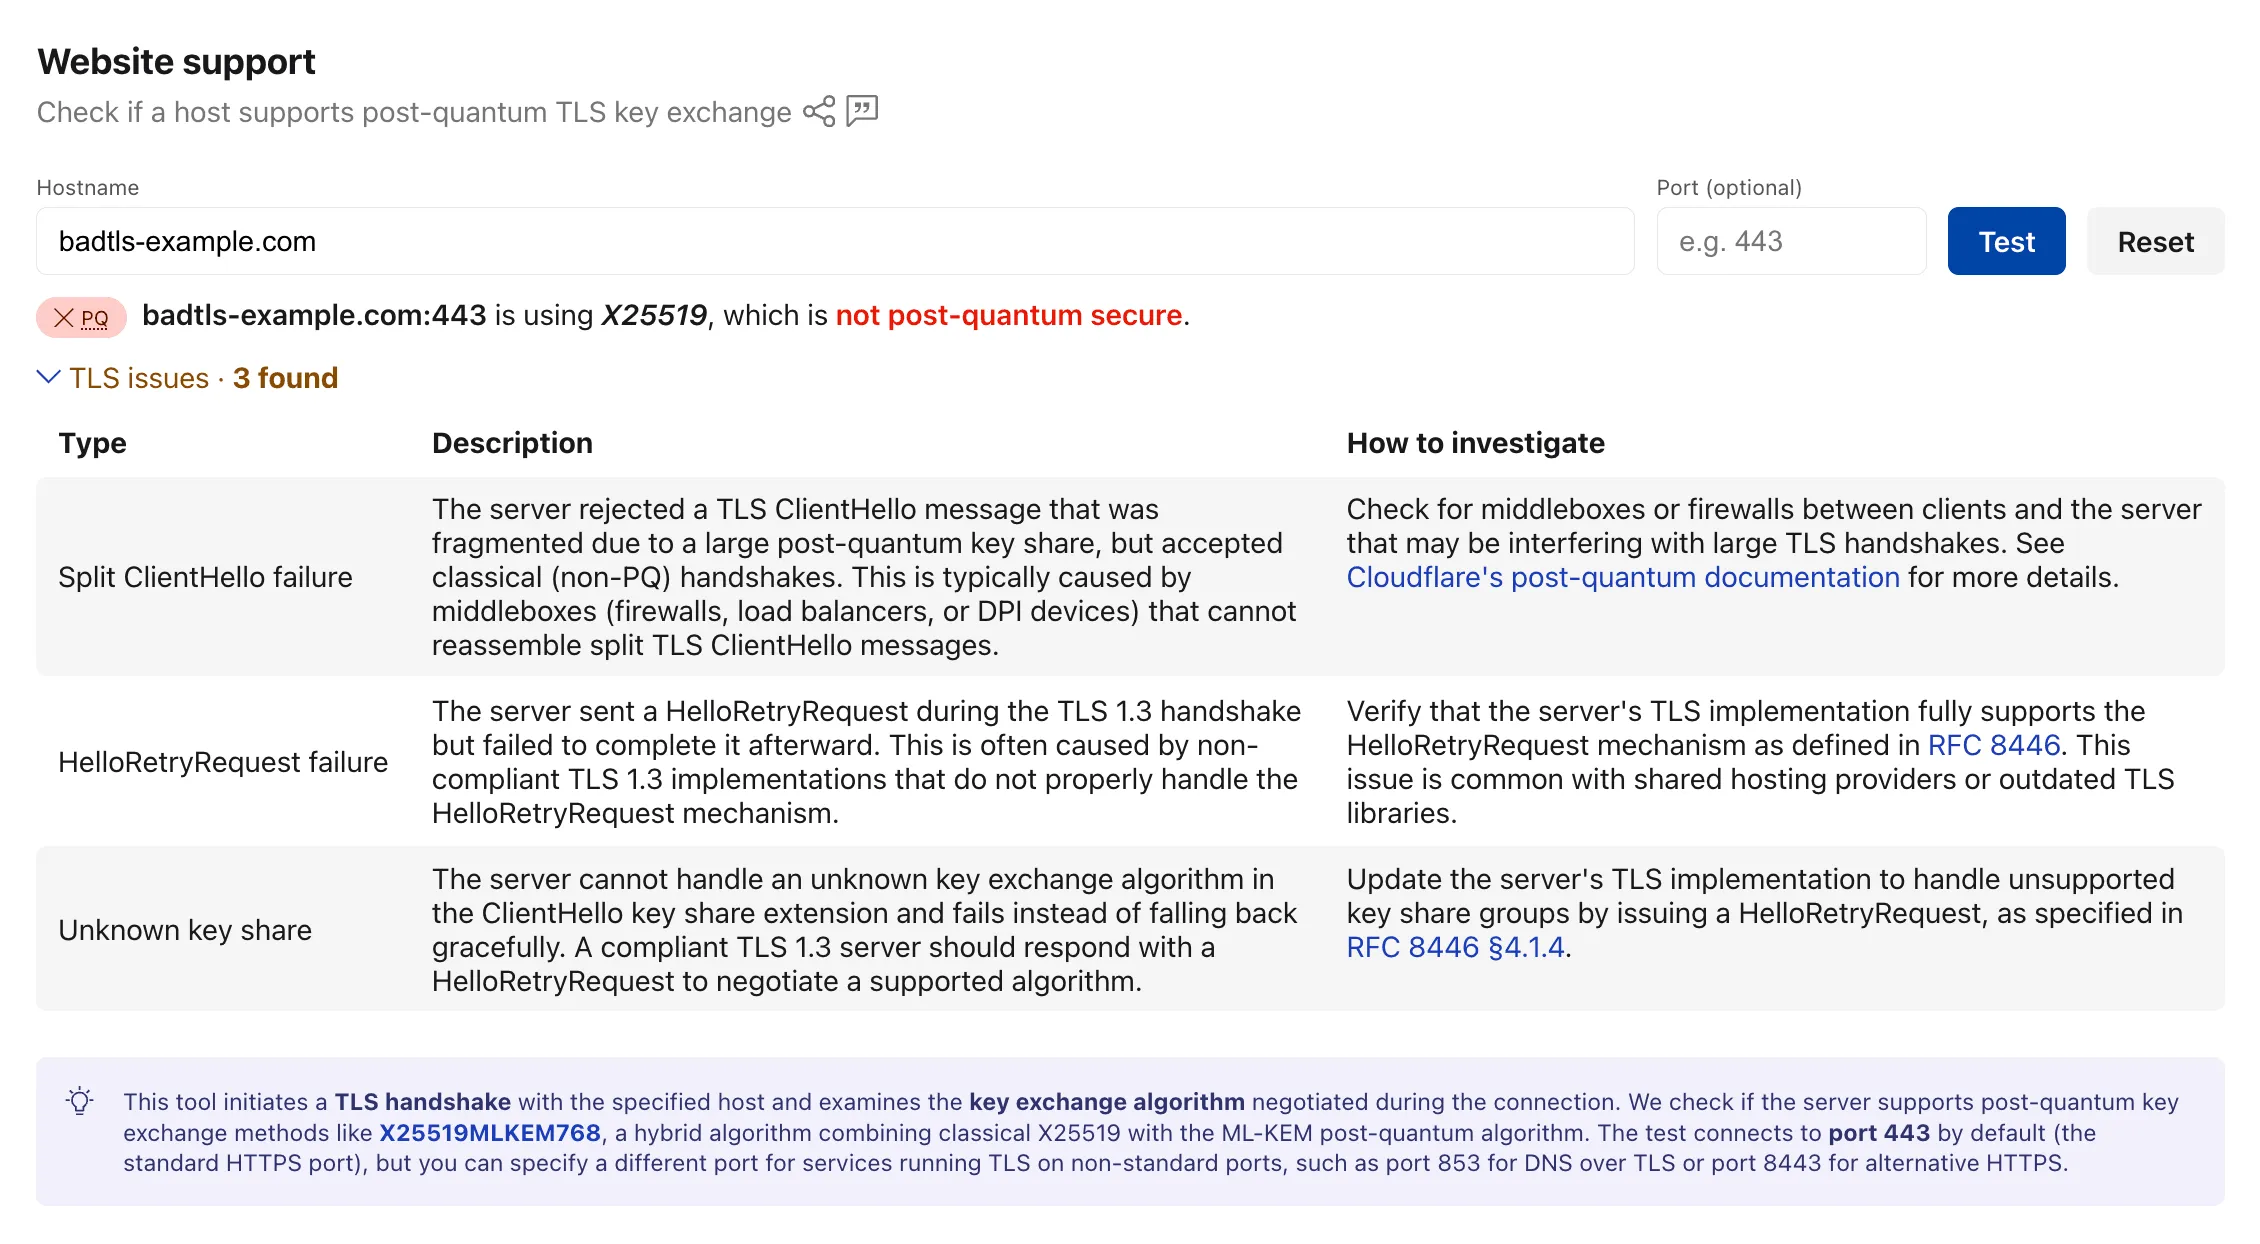
Bug detection data is available through the existing
/post_quantum/tls/supportendpoint.Visit the Post-Quantum Encryption ↗ page to test a host.
- Split ClientHello — The connection fails with a fragmented post-quantum
Cloudflare Realtime SFU is a WebRTC Selective Forwarding Unit that runs on Cloudflare's global network, so you can route live audio, video, and data between WebRTC clients around the world without managing SFU infrastructure or regions.
When you use the WebSocket adapter to stream WebRTC media to a WebSocket endpoint, the adapter now auto-reconnects and buffers audio and video after brief endpoint disconnects or restarts.
Many teams also use Realtime SFU as the media layer for backend applications, such as transcription, recording, note-taking, and agentic media-processing services. These systems often need to consume live WebRTC audio or video from the SFU in backend infrastructure, including Durable Objects, Workers, Containers, or external services, without running a WebRTC client themselves.
The WebSocket adapter bridges that gap by streaming WebRTC media from the SFU to a standard WebSocket endpoint as application-consumable payloads: PCM audio frames and JPEG video frames.
When you use the WebSocket adapter in Stream mode (egress) to send live audio or video from the SFU to your own WebSocket endpoint, the SFU now automatically reconnects after brief endpoint disconnects or restarts. This is especially helpful for long-running media pipelines where the WebSocket endpoint may briefly restart while a recording, transcription, or live analysis job is still in progress.
Previously, a brief disconnect from your WebSocket endpoint could close the adapter and require your application to recreate it before media could resume. Now, the SFU retries the same endpoint for up to 5 seconds with no API change required. If the endpoint comes back within that window, audio and video delivery resumes automatically.
The reconnect behavior also includes live-first media buffering, so brief interruptions reduce media loss without replaying stale video.
During reconnect:
- Audio uses a short bounded backlog to reduce audible loss. If the interruption lasts longer than the backlog can cover, older audio may be dropped.
- Video resumes from the latest available JPEG frame instead of replaying stale frames.
- Recovery is best effort and does not guarantee gapless or exactly-once delivery.
If the endpoint remains unavailable after the 5-second reconnect window, the adapter closes and must be recreated.
Security Insights scans now run more often. Cloudflare scans Free accounts every 7 days, Pro and Business accounts every 3 days, and Enterprise accounts daily.
In addition, all accounts and zones now receive scans by default. You no longer need to enable scans before Cloudflare checks your account for misconfigurations, vulnerabilities, and other security risks.
Granular on-demand scans are now available on any plan. You can trigger an on-demand scan for any zone, insight, insight type from the Cloudflare dashboard in order to quickly re-check your security posture after remediating an issue.
To learn more, refer to the Security Insights documentation.
When you connect third-party MCP servers through MCP server portals, you have no control over how the server author named tools or wrote descriptions. Unclear names make it harder for AI agents to select the right tool and harder for users to understand what is available.
You can now rename tools and prompts and rewrite their descriptions directly on the portal, without modifying the upstream server. For example, a tool named
super_cool_toolcan becomesearch_customer_recordswith a description tailored to your organization.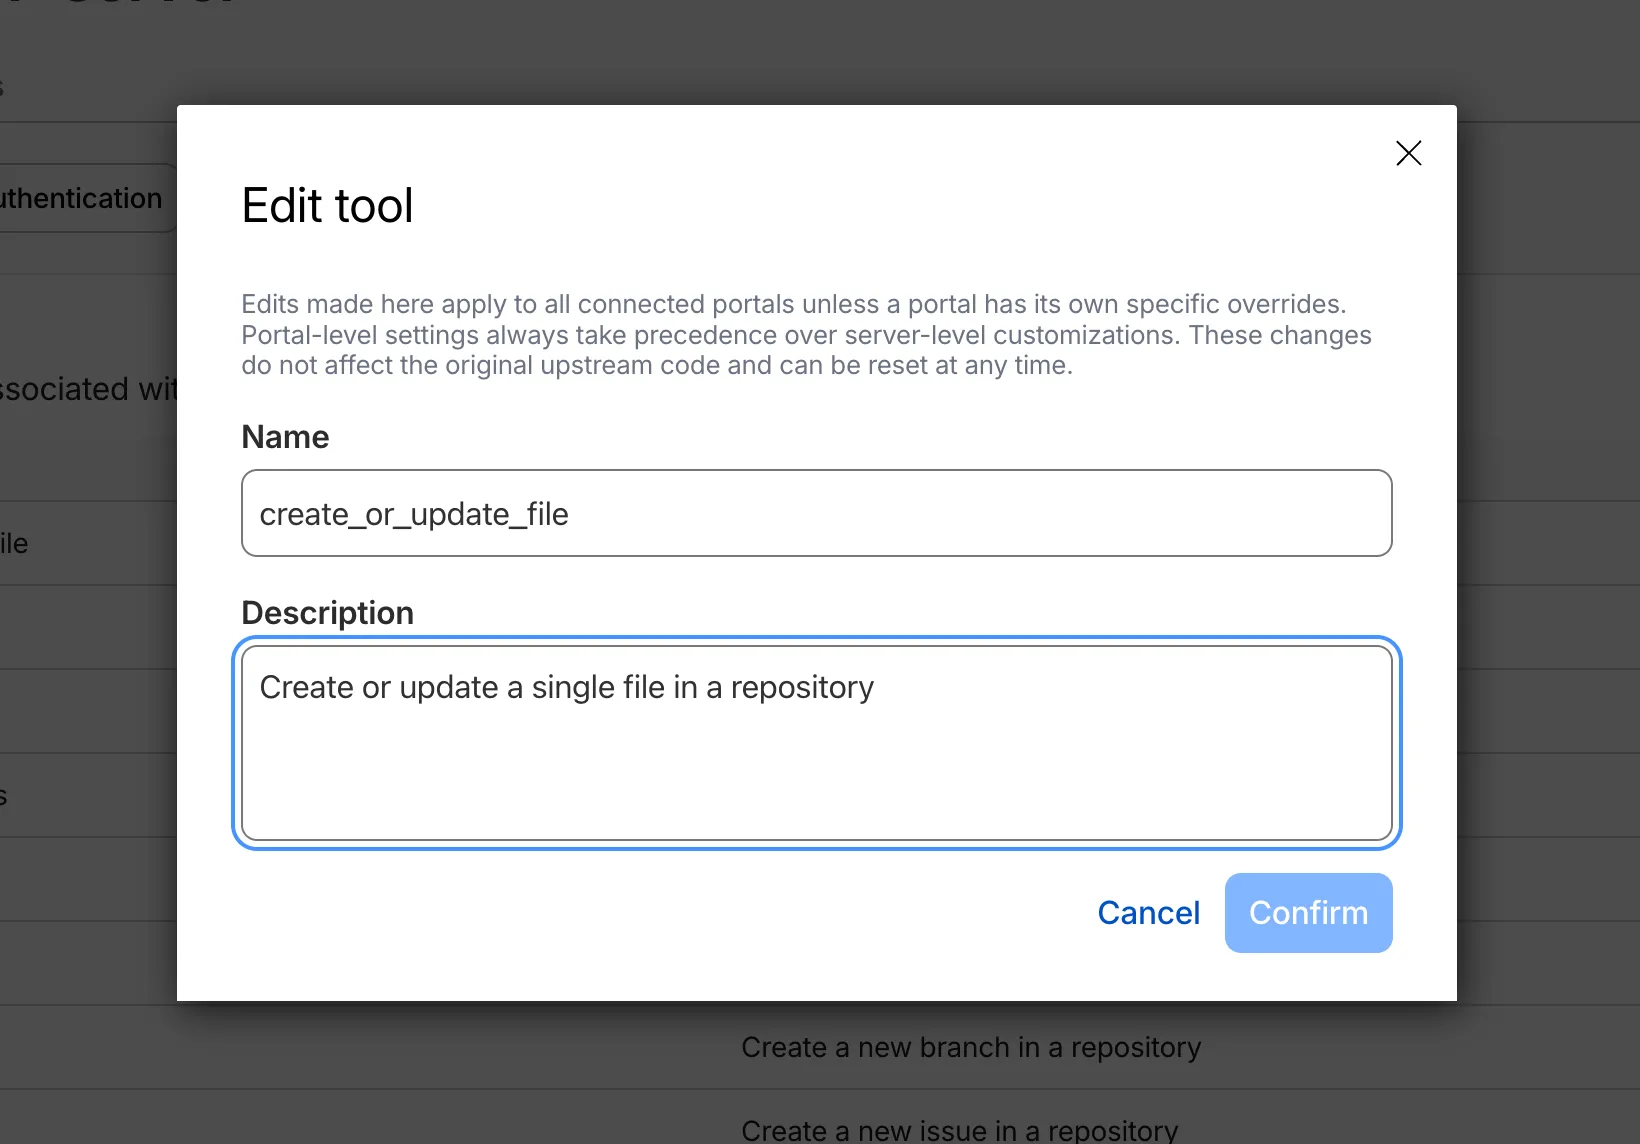
Modified tools display a Modified label in the tools list so administrators can see which tools have been customized at a glance.
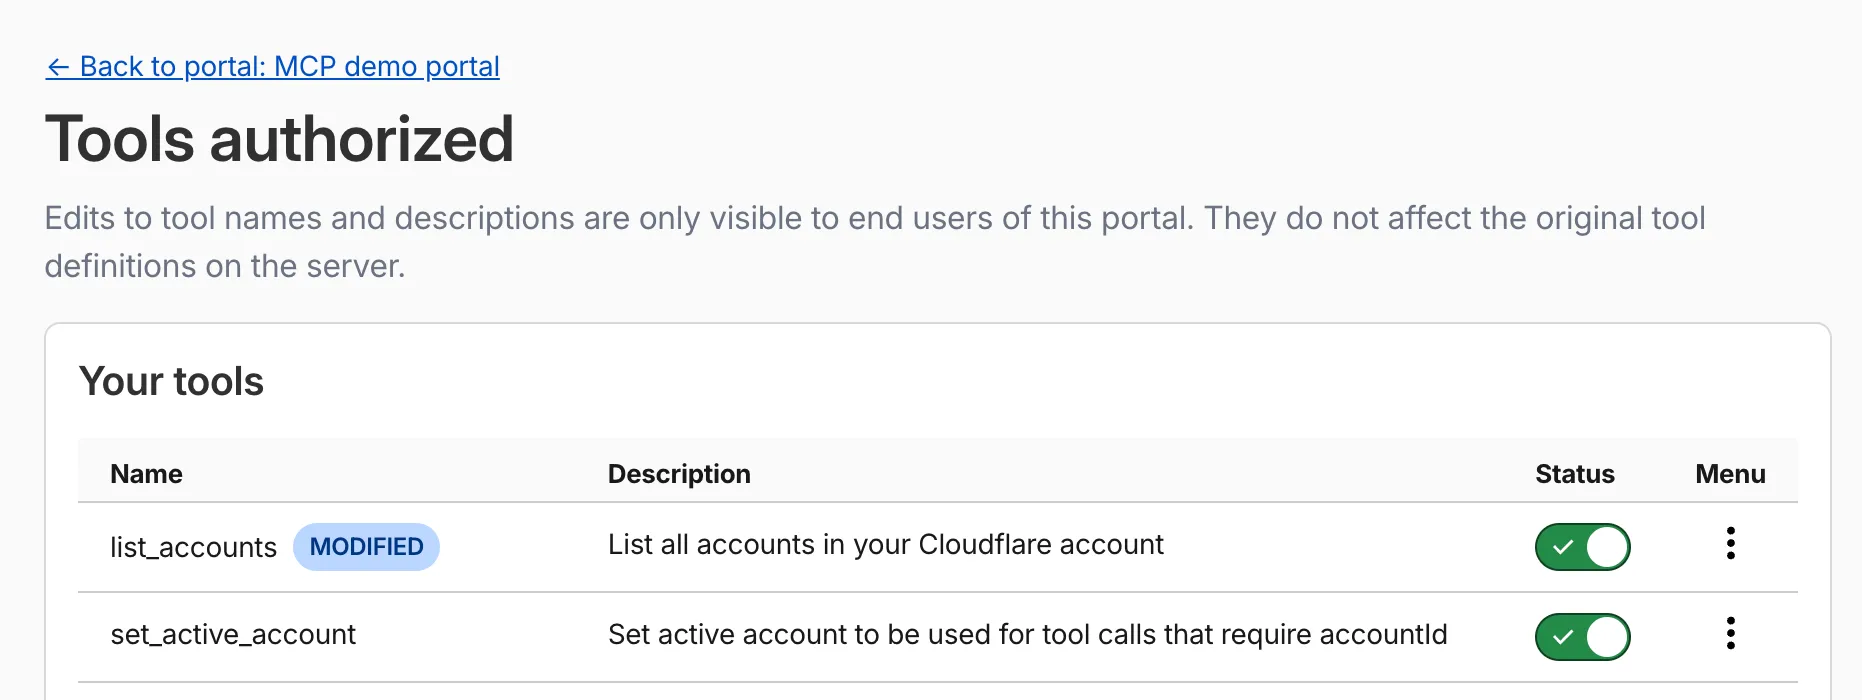
Aliases override the metadata that MCP clients receive. You can set them at two levels:
- Per portal: Applies only within a specific portal. Takes precedence over server-level aliases.
- Per server: Applies across all portals that use the server.
You can reset an alias at any time to restore the original upstream name.
For more information, refer to Tool and prompt aliases.
You can now call Browser Run Quick Actions directly from a Cloudflare Worker using the
quickAction()method on the browser binding. This simplifies how Workers interact with Browser Run by removing the need for API tokens or external HTTP requests. Your Worker communicates with Browser Run directly over Cloudflare's network, resulting in simpler code and lower latency.With the
quickAction()method you can:- Capture screenshots from URLs or HTML
- Generate PDFs with custom styling, headers, and footers
- Extract HTML content from fully rendered pages
- Convert pages to Markdown
- Extract structured JSON using AI
- Scrape elements with CSS selectors
- Get all links from a page
- Capture snapshots (HTML + screenshot in one request)
To get started, add a browser binding to your Wrangler configuration:
JSONC {"compatibility_date": "2026-03-24","browser": {"binding": "BROWSER"}}TOML compatibility_date = "2026-03-24"[browser]binding = "BROWSER"Then call any Quick Action directly from your Worker. For example, to capture a screenshot:
JavaScript const screenshot = await env.BROWSER.quickAction("screenshot", {url: "https://www.cloudflare.com/",});TypeScript const screenshot = await env.BROWSER.quickAction("screenshot", {url: "https://www.cloudflare.com/",});The
quickAction()method requires a compatibility date of2026-03-24or later.For setup instructions and the full list of available actions, refer to Browser Run Quick Actions.
The Cloudflare Mesh dashboard now shows per-replica details for high availability nodes. You can see which replica is active, view each replica's Mesh IP and connection details, and manually trigger failover — all from the node detail page.
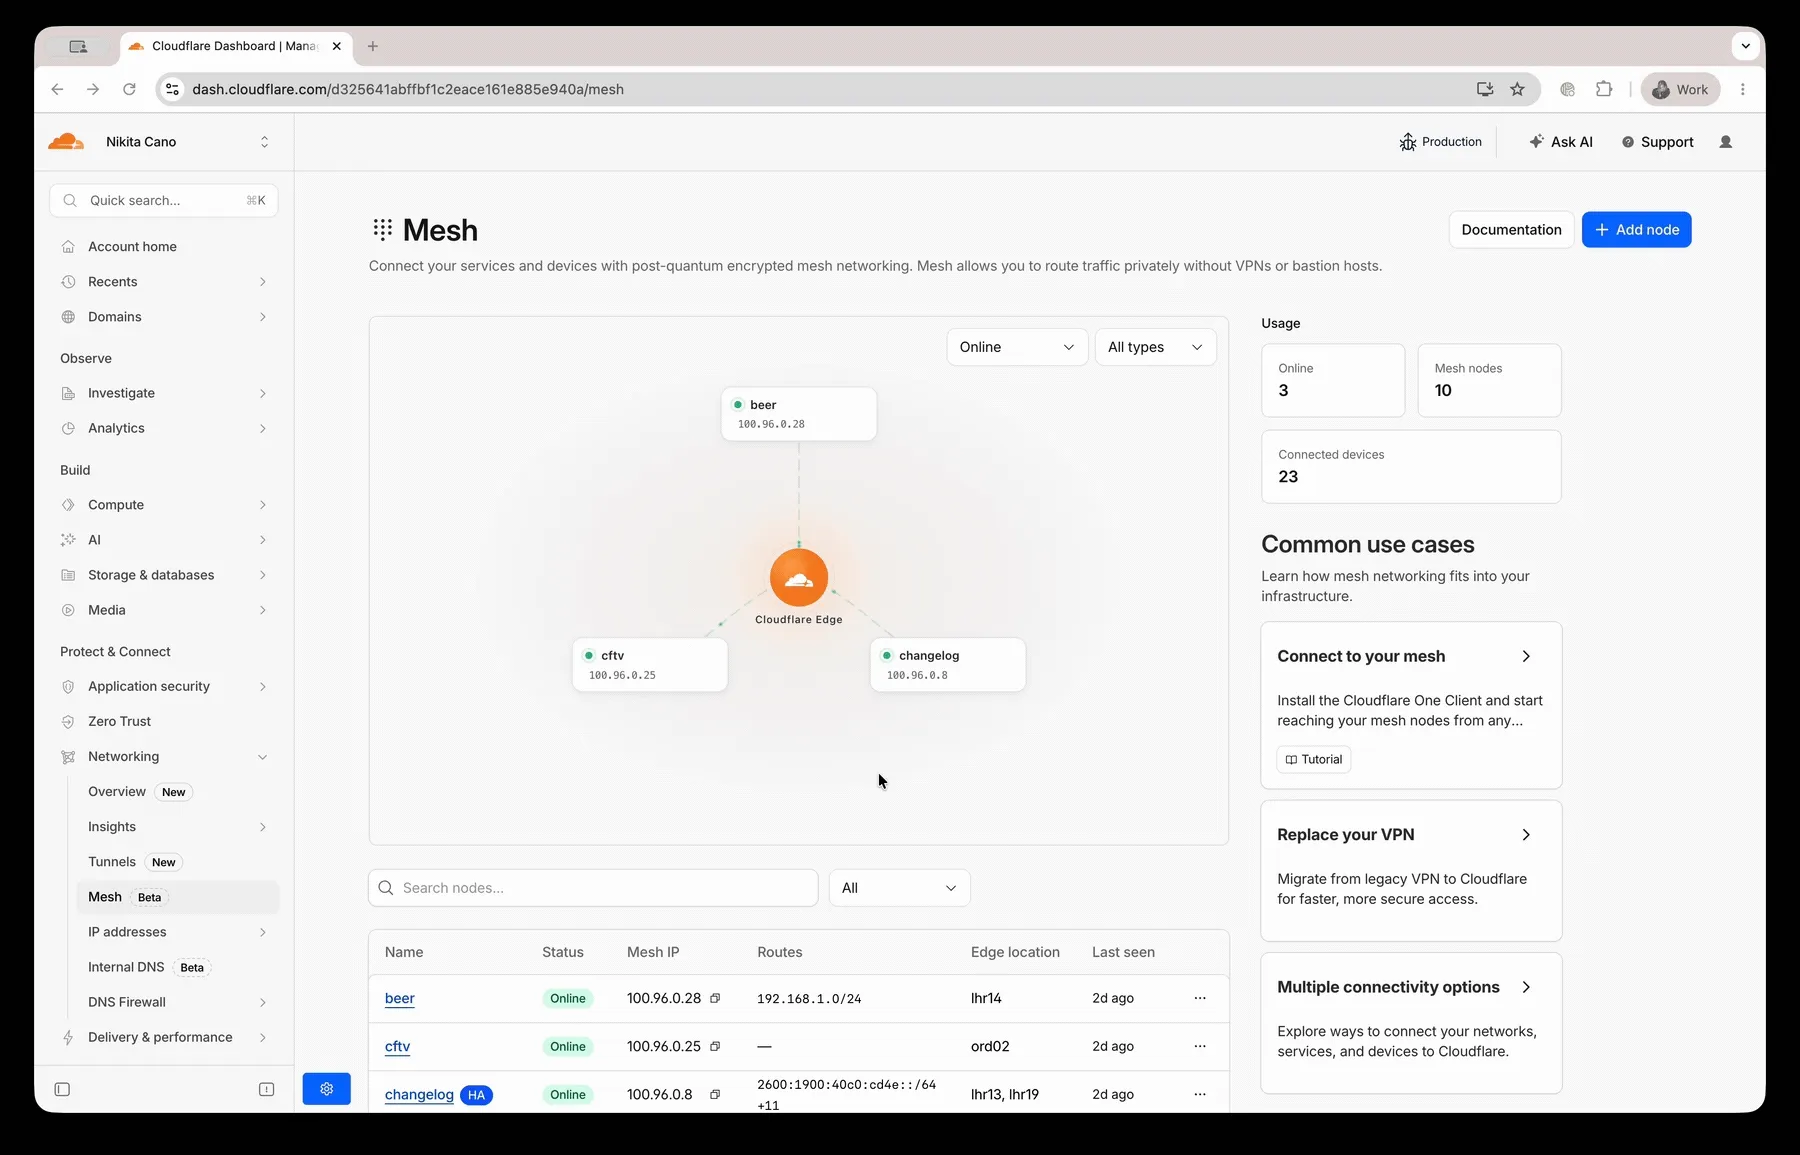
- Replica tabs on the node detail page — switch between replicas to see each one's Mesh IP, edge data center, origin IP, platform, version, and uptime.
- Active/passive badges identify which replica is currently routing traffic.
- Manual failover — promote a passive replica to active with a single click. The previous active replica switches to standby.
- HA badge in the overview table identifies nodes running multiple replicas.
- Active replica IP shown in the overview table — the dashboard now resolves which replica is active and displays the correct Mesh IP.
To manually promote a passive replica:
- In the Cloudflare dashboard ↗, go to Networking > Mesh.
- Select an HA-enabled node.
- Select the passive replica tab.
- Select Promote to active and confirm.
Traffic reroutes to the promoted replica immediately. Refer to High availability for details on failover behavior.
Wrangler supports using
wrangler containers sshas an OpenSSHProxyCommandfor Containers. This lets your local SSH client connect to a running Container through Wrangler.Terminal window ssh -o ProxyCommand="wrangler containers ssh %h" cloudchamber@<INSTANCE_ID>When standard input and output are piped, Wrangler forwards data to the SSH server in the Container. You can also pass
--stdioto force this mode.For more information, refer to the SSH documentation.
You can now send emails with display names on recipient addresses in addition to the existing
fromsupport. Pass an object withemailand an optionalnamefield forto,cc,bcc,replyTo, orfrom:src/index.js export default {async fetch(request, env) {const response = await env.EMAIL.send({from: { email: "support@example.com", name: "Support Team" },to: { email: "jane@example.com", name: "Jane Doe" },cc: ["manager@company.com",{ email: "team@company.com", name: "Engineering Team" },],subject: "Welcome!",html: "<h1>Thanks for joining!</h1>",text: "Thanks for joining!",});return Response.json({ messageId: response.messageId });},};src/index.ts export default {async fetch(request, env): Promise<Response> {const response = await env.EMAIL.send({from: { email: "support@example.com", name: "Support Team" },to: { email: "jane@example.com", name: "Jane Doe" },cc: ["manager@company.com",{ email: "team@company.com", name: "Engineering Team" },],subject: "Welcome!",html: "<h1>Thanks for joining!</h1>",text: "Thanks for joining!",});return Response.json({ messageId: response.messageId });},} satisfies ExportedHandler<Env>;Plain strings remain fully supported for backward compatibility, and you can mix strings and named objects in the same array.
Refer to the Workers API and REST API documentation for full request examples.
Cloudflare Pipelines is a streaming data platform that ingests events, transforms them with SQL, and writes to R2 as JSON, Parquet, or Apache Iceberg ↗ tables. Pipelines now has published pricing based on two usage dimensions: the volume of data processed by SQL transforms and the volume of data delivered to sinks. Ingress into a Pipeline stream is free.
Billing is not yet enabled. We will provide at least 30 days notice before we start charging for Pipelines usage.
Pipelines pricing model is designed to charge per GB based on what you use:
- Streams (ingress): Free, regardless of volume.
- SQL transforms: $0.04 / GB for stateless transforms (filter, reshape, unnest, cast, compute).
- Sinks: $0.03 / GB for JSON, $0.06 / GB for Parquet or Iceberg output.
Workers Free plans include 1 GB / month for each dimension. Workers Paid plans include 50 GB / month.
For full pricing details and billing examples, refer to Pipelines pricing.
R2 SQL is a serverless, distributed query engine that runs SQL against Apache Iceberg ↗ tables stored in R2 Data Catalog. R2 SQL now has published pricing based on a single dimension: the volume of compressed data scanned to execute your queries. At $2.50 / TB ($0.0025 / GB), R2 SQL is priced at half the cost of AWS Athena and less than half of Google BigQuery on-demand.
Billing is not yet enabled. We will provide at least 30 days notice before we start charging for R2 SQL usage.
Data scanned is measured on compressed bytes read from R2 object storage. This matches what you see in your R2 bucket — if a Parquet file is 100 MB on disk, scanning that file bills for 100 MB. Each query has a minimum billing increment of 10 MB.
Free plans include 1 GB / month and Paid plans include 10 GB / month. Standard R2 storage and operations and R2 Data Catalog charges apply separately.
For full pricing details and billing examples, refer to R2 SQL pricing.
R2 Data Catalog is a managed Apache Iceberg ↗ data catalog built directly into R2 buckets, queryable by any Iceberg-compatible engine such as Spark, Snowflake, and DuckDB. R2 Data Catalog now has published pricing for catalog operations and table compaction, in addition to standard R2 storage and operations.
Billing is not yet enabled. We will provide at least 30 days notice before we start charging for R2 Data Catalog usage.
Pricing is based on two dimensions:
- Catalog operations: $9.00 / million operations for metadata requests such as creating tables, reading table metadata, and updating table properties.
- Compaction: $0.005 / GB processed and $2.00 / million objects processed. These charges only apply when automatic compaction is turned on for a table.
Both dimensions include a monthly free tier: 1 million catalog operations, 10 GB of compaction data processed, and 1 million compaction objects processed.
For full pricing details and billing examples, refer to R2 Data Catalog pricing.